簡介
Alertmanager 主要用于接收 Prometheus 發(fā)送的告警信息,它很容易做到告警信息的去重�����,降噪�,分組,策略路由��,是一款前衛(wèi)的告警通知系統(tǒng)���。它支持豐富的告警通知渠道,可以將告警信息轉發(fā)到郵箱�����、企業(yè)微信�����、釘釘?shù)取_@一節(jié)講解利用AlertManager����,把接受到的告警信息,轉發(fā)到郵箱����。
實驗
準備
啟動 http-simulator 度量模擬器:
docker run --name http-simulator -d -p 8080:8080 pierrevincent/prom-http-simulator:0.1
啟動 Prometheus,為了方便更新配置�����,使用掛載配置文件的方式:
docker run --name prometheus -d -p 9090:9090 -v /Users/huanchu/Documents/prometheus-data:/prometheus-data \

  prom/prometheus --web.enable-lifecycle --config.file=/prometheus-data/prometheus.yml
啟動添加了參數(shù) --web.enable-lifecycle����,讓Prometheus支持通過web端點動態(tài)更新配置。
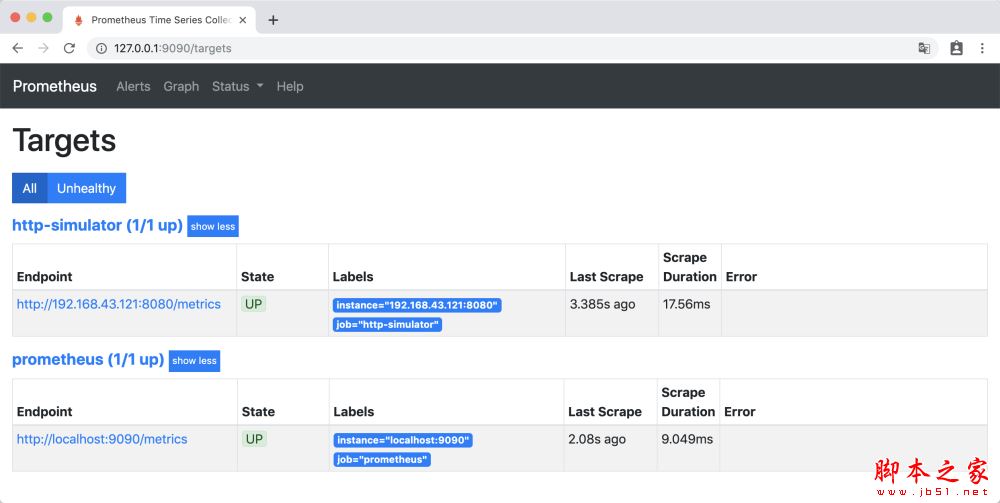
訪問http://127.0.0.1:9090/targets ��,Prometheus 自身的 metrics 和 http-simulator 的 metrics 處于up 狀態(tài) �����,那么準備工作就做好了����。
實驗
實驗1
告警配置
在prometheus-data文件夾下�����,創(chuàng)建告警配置文件 simulator_alert_rules.yml:
groups:
- name: simulator-alert-rule
 rules:
 - alert: HttpSimulatorDown
 expr: sum(up{job="http-simulator"}) == 0
 for: 1m
 labels:
  severity: critical
配置文件的意思是 http-simulator 服務up狀態(tài)為 0 ����,并且持續(xù)1分鐘時���,產生告警 ����,級別為 “嚴重的”���。
修改prometheus.yml��,引用simulator_alert_rules.yml文件�����,prometheus.yml 內容如下:
global:
 scrape_interval: 5s
 evaluation_interval: 5s
 scrape_timeout: 5s
rule_files:
 - "simulator_alert_rules.yml"
scrape_configs:
 - job_name: 'prometheus'
 static_configs:
 - targets: ['localhost:9090']
 - job_name: 'http-simulator'
 metrics_path: /metrics
 static_configs:
 - targets: ['192.168.43.121:8080']
更新Prometheus配置:
curl -X POST http://localhost:9090/-/reload
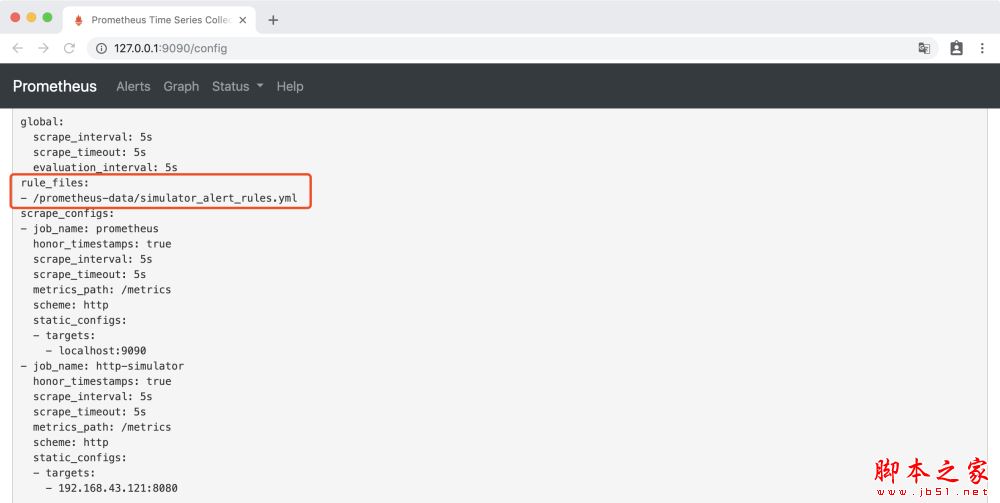
訪問http://127.0.0.1:9090/config,可以看到已經為更新了配置:
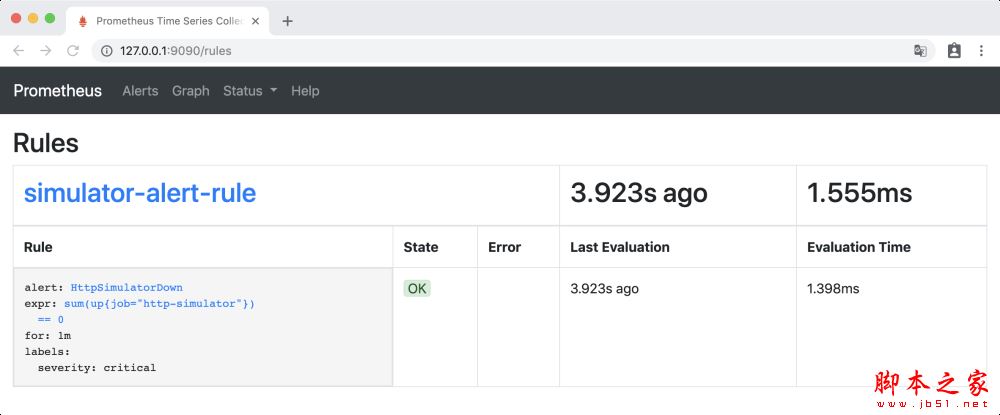
訪問http://127.0.0.1:9090/rules���,Rules 下出現(xiàn)了新添加的告警規(guī)則:
驗證
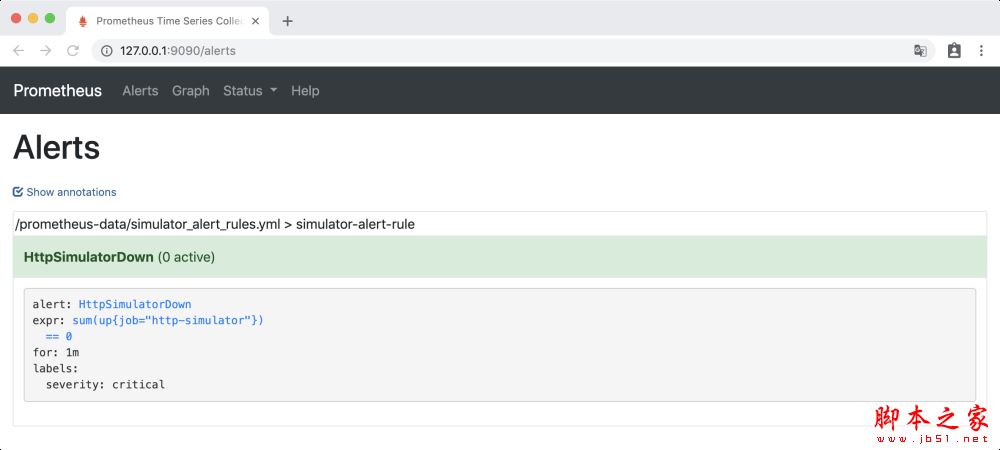
訪問http://127.0.0.1:9090/alerts �����,Alerts 下 HttpSimulatorDown 為綠色�,處于INACTIVE 狀態(tài),表示什么都沒有發(fā)生�����。
關閉 http-simulator 服務:
docker stop http-simulator
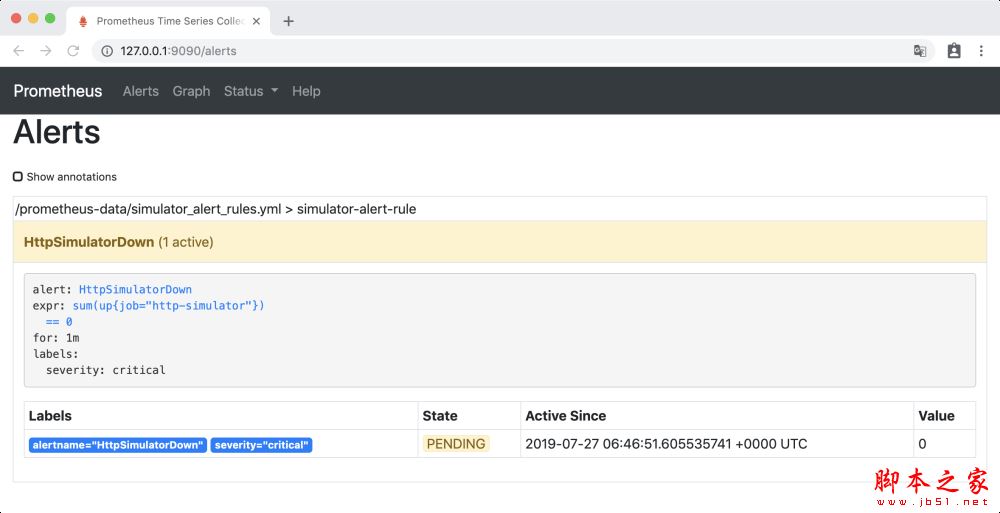
訪問http://127.0.0.1:9090/alerts���,HttpSimulatorDown 變成黃色�,處于 PENDING 狀態(tài)����,表示報警即將被激活。
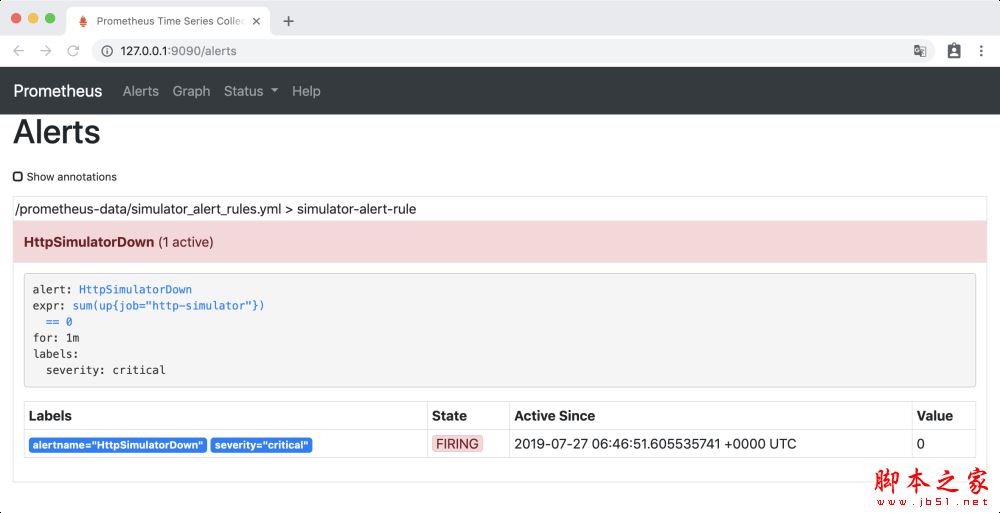
一分鐘后�����,HttpSimulatorDown 變成紅色���,處于 FIRING 狀態(tài)�,表示報警已經被激活了。
實驗2
告警配置
在simulator_alert_rules.yml文件中增加告警配置:
- alert: ErrorRateHigh
 expr: sum(rate(http_requests_total{job="http-simulator", status="500"}[5m])) / sum(rate(http_requests_total{job="http-simulator"}[5m])) > 0.02
 for: 1m
 labels:
  severity: major
 annotations:
  summary: "High Error Rate detected"
  description: "Error Rate is above 2% (current value is: {{ $value }}"
配置文件的意思是 http-simulator 請求的錯誤率對2% ���,并且持續(xù)1分鐘時����,產生告警 �����,級別為 “非常嚴重的”
更新Prometheus配置:
curl -X POST http://localhost:9090/-/reload
驗證
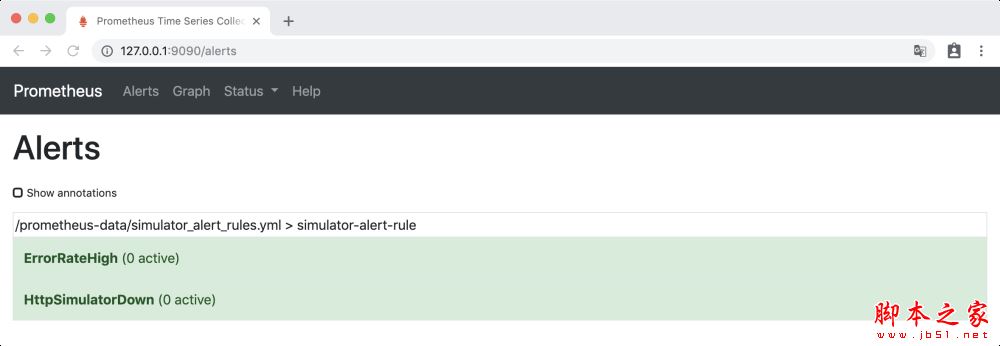
訪問http://127.0.0.1:9090/alerts�����,ErrorRateHigh 為綠色的 INACTIVE 狀態(tài)���。
把 http-simulator 的錯誤率調到 10%
curl -H 'Content-Type: application/json' -X PUT -d '{"error_rate": 10}' http://localhost:8080/error_rate
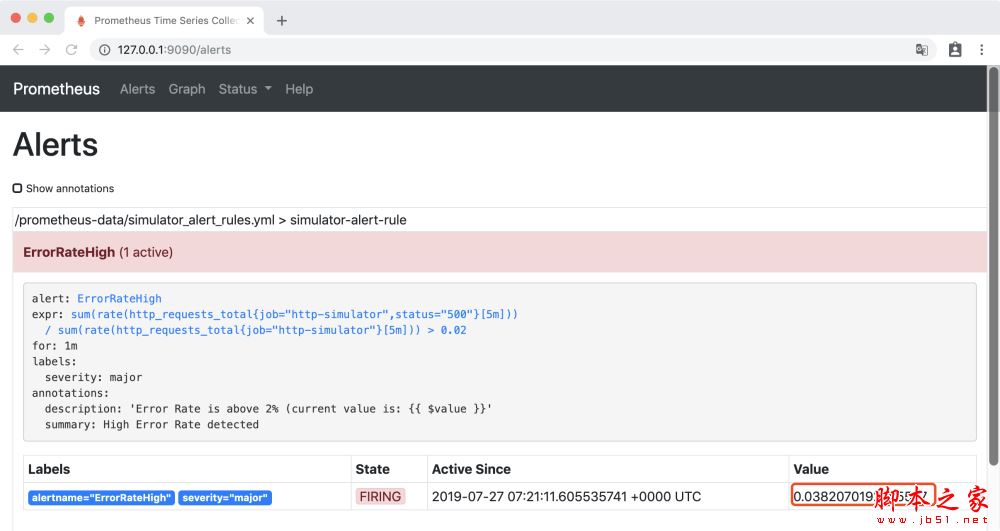
稍等一會后����,訪問http://127.0.0.1:9090/alerts�, 可以看到錯誤率已經大2%,ErrorRateHigh 為紅色的 FIRING 狀態(tài)����,報警已經被激活了。
安裝和配置AlertManager
通過docker 掛載文件的方式安裝AlertManager�,在本地創(chuàng)建文件夾 alertmanager-data 文件夾,在其中創(chuàng)建 alertmanager.yml�����,內容如下:
global:
smtp_smarthost: 'smtp.163.com:25'
smtp_from: 'xxxxx@163.com'
smtp_auth_username: 'xxxxx@163.com'
smtp_auth_password: 'xxxxx'
route:
group_interval: 1m #當?shù)谝粋€報警發(fā)送后���,等待'group_interval'時間來發(fā)送新的一組報警信息
repeat_interval: 1m # 如果一個報警信息已經發(fā)送成功了�,等待'repeat_interval'時間來重新發(fā)送他們
receiver: 'mail-receiver'
receivers:
- name: 'mail-receiver'
email_configs:
- to: 'xxxxxx@163.com'
啟動 AlertManager:
docker run --name alertmanager -d -p 9093:9093 -v /Users/huanchu/Documents/alertmanager-data:/alertmanager-data \

  prom/alertmanager --config.file=/alertmanager-data/alertmanager.yml
在Prometheus目錄下��,修改prometheus.yml配置Alertmanager地址:
# Alertmanager configuration
alerting:
 alertmanagers:
 - static_configs:
 - targets:
  - 192.168.43.121:9093
更新Prometheus配置:
curl -X POST http://localhost:9090/-/reload
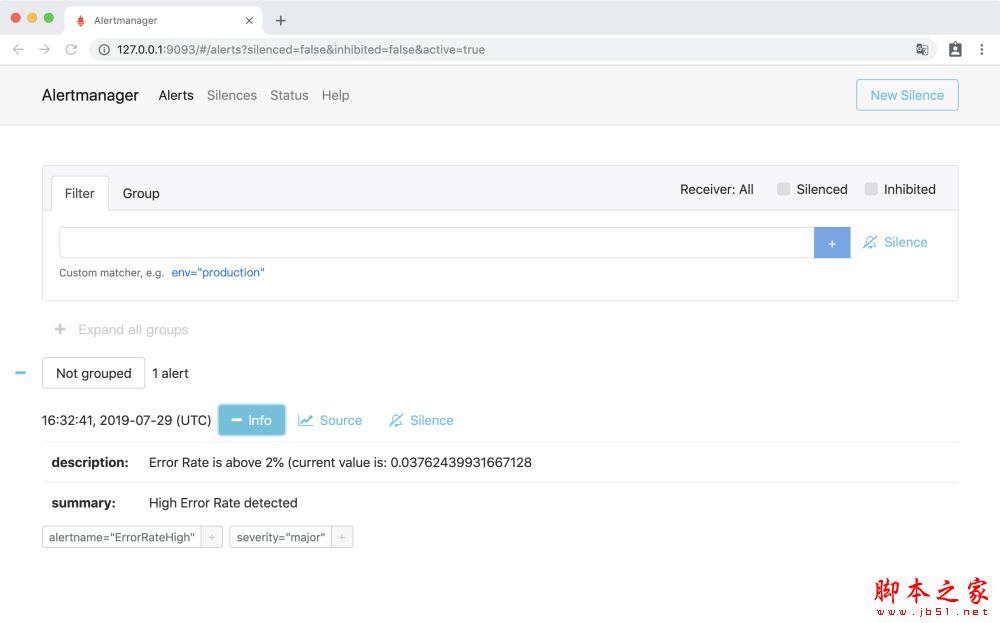
訪問http://127.0.0.1:9093�,訪問Alertmanager UI界面,可以看到接收到ErrorRateHigh告警:
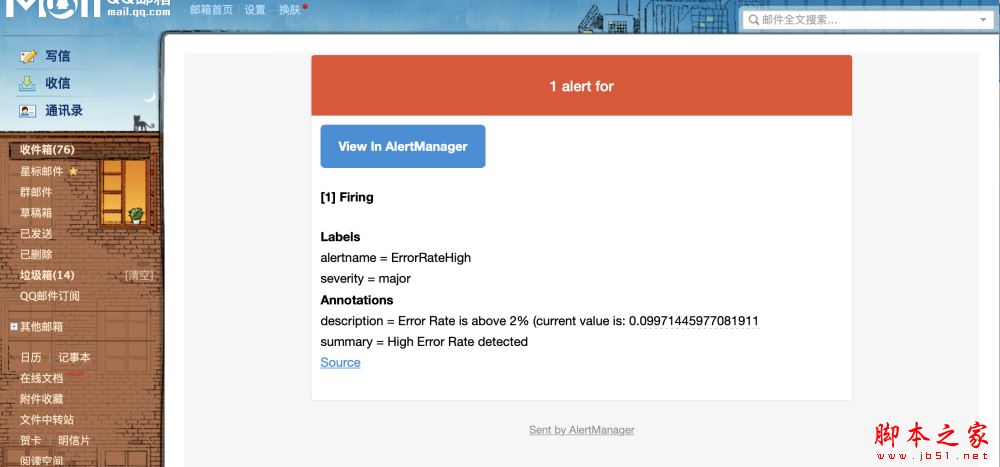
郵箱會收到告警信息:
總結
以上所述是小編給大家介紹的Prometheus 整合 AlertManager的教程詳解,希望對大家有所幫助�����,如果大家有任何疑問請給我留言����,小編會及時回復大家的。在此也非常感謝大家對腳本之家網站的支持���!
如果你覺得本文對你有幫助�,歡迎轉載,煩請注明出處����,謝謝!